HalfTrend Long/Short Signal Engine (BigBeluga): tested
What it claims
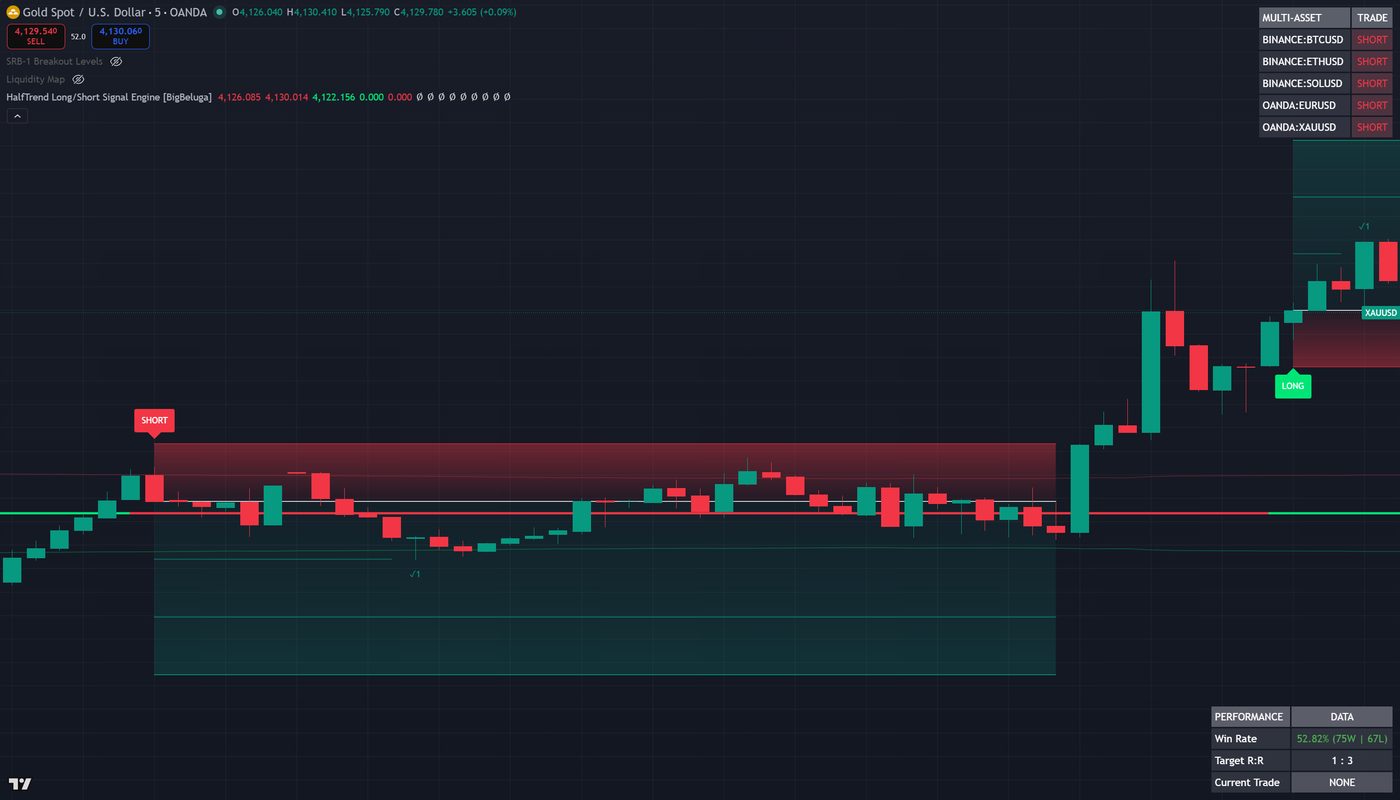
Its on-chart dashboard shows a win rate next to a 1:3 risk-reward target. On gold's 5-minute chart on 8 October 2026 it read 52.82% (75 wins, 67 losses). At 1:3 a trader only needs to win 25% of trades to break even, so the dashboard reads like a large edge.
What we tested
2,297 of its own signals on gold, EURUSD, Nasdaq 100, S&P 500, USDJPY and Bitcoin at 1, 5 and 15 minutes (OANDA and Bitstamp prices), default inputs, entered at the next bar's open with its own stop and targets, closed at its 3R target, its stop, or an opposite signal.
Trading costs make it worse: about -0.23R per trade after spreads and commissions.
Why
The dashboard does not count trades. Each target a trade touches adds a win; if the trade then hits its stop, one win is taken back instead of a loss being added. So a trade that reaches its first target and then loses counts as nothing, and only trades stopped before the first target count as losses. We watched this happen trade by trade in TradingView's bar replay. Counted per trade, too few reach the 1:3 target to cover the losers.
How its dashboard counts
- Target 1 reached: +1 win
- Target 2 reached: +1 win
- Stop hit after a target: -1 win, no loss
- Stop hit before target 1: +1 loss
Limits of this test
- Tested at its default inputs; its Amplitude and Channel Deviation settings could not be varied (the script is closed-source).
- Other stop and target sizes on its signals were also tried (24 combinations); the best was weaker than the best that coin-flip directions produce over the same search.
Measured results, not advice. We have no commercial link with BigBeluga. If you made this tool and think a figure is wrong, write to corrections@trackedsignals.com; corrections are published within 7 days. How we test.